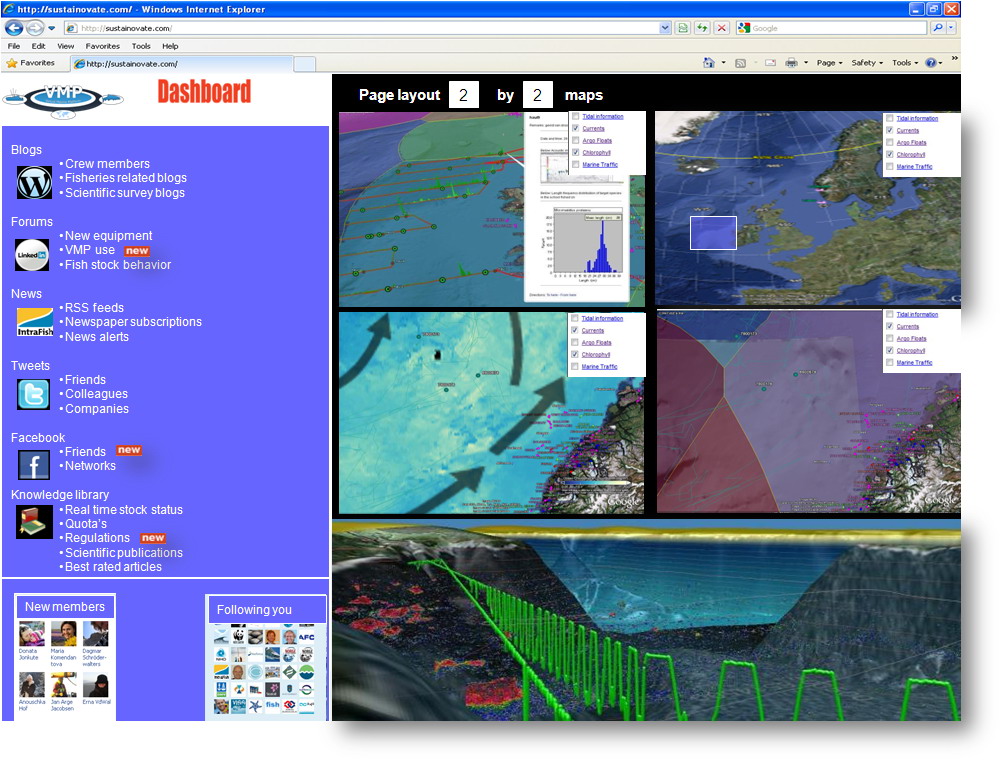
Skippers dashboard software
In our project the vessel will continuously collect and supply catch and environmental data. Information such as temperature data at fishing depth can be easily extracted from sensors. In addition, the skipper will provide his ideas on correlations based on his experience; this is an essential part of the project preparation. We have also given scientists in this project a different challenge since they have the advantage of having access to huge amounts of environmental data which could be linked to catch results for doing predictions. Data collection, -analysis and -modelling will therefore be their main activities, where they will be ground-truthing the skipper’s hypotheses. With correlations and models within reach the skipper would be better able to understand where bycatch is most likely to occur throughout the year.
The Skippers Dashboard is a computer programme that forms the platform where environmental data and historic catch data are collected, manipulated and visualised to predict where bycatch is most likely to occur. It collects (publicly available) environmental information such as zooplankton distributions, seawater temperature, wind predictions, tide and currents and combines it with historic (by-)catch data.
The Dashboard gives 2 results:
it provides the skipper with an overall picture of the fishing grounds helping him better understand local dynamics
it can also predict where bycatch is most like to occur. It can do this by comparing the conditions now with similar conditions in the past, and showing where bycatch were found back then. This is a very fundamental but worthwhile way of eliminating bycatch: simply not to fish where you expect high bycatch rates.


